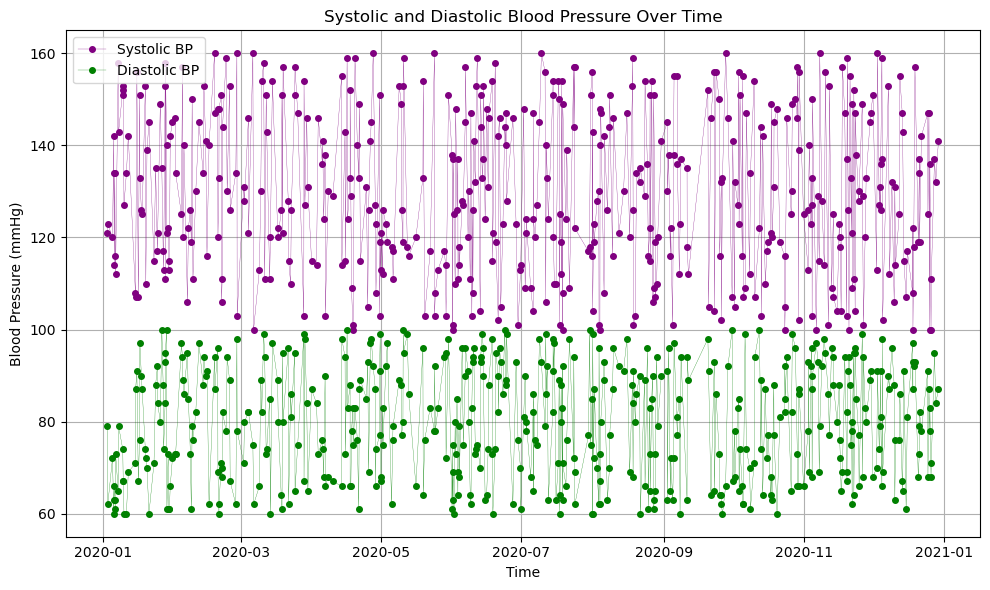
We generate random Open mHealth blood pressure readings, and visualize them with matplotlib.
%pip install -q pandas matplotlib requestsNote: you may need to restart the kernel to use updated packages.
import random
from datetime import datetime, timedelta

import pandas as pd
import matplotlib.pyplot as plt
def generate_blood_pressure_readings(num_readings):
'''
Generate random Open mHealth blood pressure readings.
https://www.openmhealth.org/documentation/#/schema-docs/schema-library/schemas/omh_blood-pressure
'''
readings = []
start_time = datetime(2020, 1, 1, 0, 0, 0)
for _ in range(num_readings):
# Generate random systolic and diastolic blood pressure values
systolic = random.randint(100, 160) # Assuming normal range for systolic pressure
diastolic = random.randint(60, 100) # Assuming normal range for diastolic pressure
# Generate random measurement location, body posture, and temporal relationship to physical activity
body_posture = random.choice(["sitting", "standing"])
measurement_location = random.choice(["left wrist", "right wrist"])
temporal_relationship_to_physical_activity = random.choice(["at rest", "during exercise"])
# Generate a random effective time frame
time_frame = start_time + timedelta(minutes=random.randint(1, 60*24*365))
# Append the reading to the list
readings.append({
"systolic_blood_pressure": {"value": systolic, "unit": "mmHg"},
"diastolic_blood_pressure": {"value": diastolic, "unit": "mmHg"},
"body_posture": body_posture,
"measurement_location": measurement_location,
"temporal_relationship_to_physical_activity": temporal_relationship_to_physical_activity,
"effective_time_frame": { "date_time": time_frame.strftime("%Y-%m-%dT%H:%M:%SZ") }
})
return readingsdef plot_readings_over_time(readings):
'''
Plot Open mHealth blood pressure readings.
'''
# Create a DataFrame from the readings
df = pd.DataFrame(readings)
# Convert effective_time_frame to datetime format
df['effective_time_frame'] = pd.to_datetime(df['effective_time_frame'].apply(lambda x: x['date_time']))
# Sort DataFrame by effective_time_frame
df = df.sort_values(by='effective_time_frame')
# Plot systolic and diastolic blood pressure over time
plt.figure(figsize=(10, 6))
plt.plot(df['effective_time_frame'], df['systolic_blood_pressure'].apply(lambda x: x['value']),
label='Systolic BP', color='purple', marker='o', markersize=4, linewidth=0.2)
plt.plot(df['effective_time_frame'], df['diastolic_blood_pressure'].apply(lambda x: x['value']),
label='Diastolic BP', color='green', marker='o', markersize=4, linewidth=0.2)
plt.xlabel('Time')
plt.ylabel('Blood Pressure (mmHg)')
plt.title('Systolic and Diastolic Blood Pressure Over Time')
plt.legend()
plt.grid(True)
plt.tight_layout()
plt.show()# Generate synthetic blood pressure readings
num_readings = 500
readings = generate_blood_pressure_readings(num_readings)plot_readings_over_time(readings)
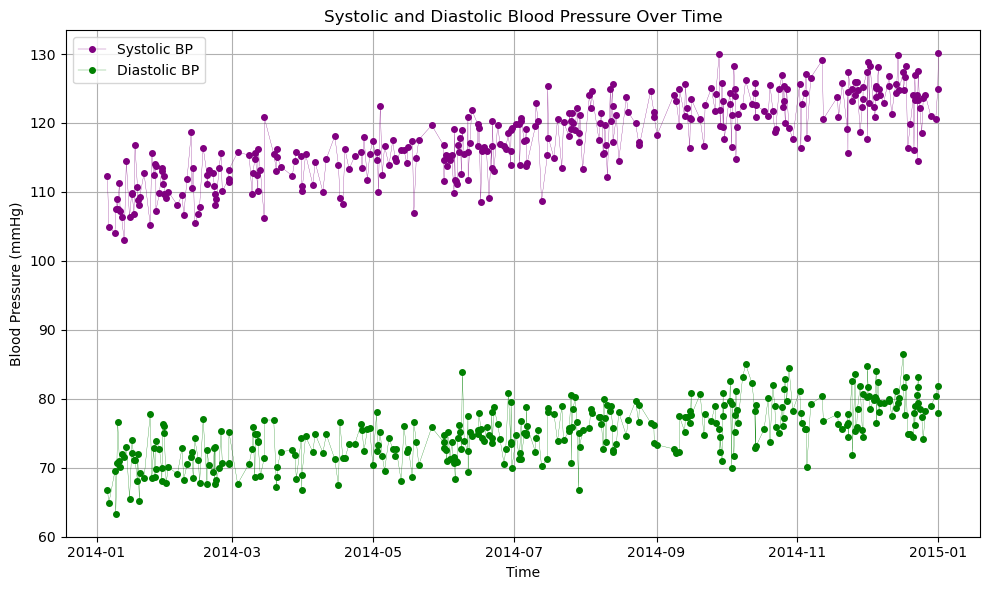
Data from Open mHealth web-visualizations
A javascript visualization at https://
jasper_speicher_data_url = 'https://gist.githubusercontent.com/jasperSpeicher/3a6af8226182880d75d2/raw/1yr.json'import requestsr = requests.get(jasper_speicher_data_url)
jasper_speicher_data = r.json()filtered_data = [item['body'] for item in jasper_speicher_data
if 'body' in item
and 'effective_time_frame' in item['body']
and 'systolic_blood_pressure' in item['body']
and 'diastolic_blood_pressure' in item['body']]
plot_readings_over_time(filtered_data)